Introducting Backgrounds for Animint
Kevin
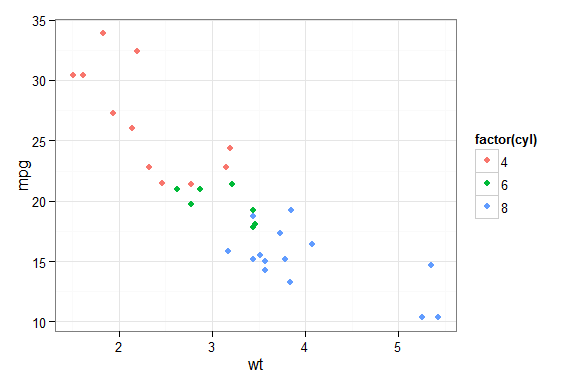
Animint is an R package designed to create animated and interactive web graphics. It takes a simple ggplot like this one ...
library(ggplot2)
p <- qplot(wt, mpg, colour = factor(cyl), data = mtcars)
p

... and turns it into an SVG vizualization. The real power of animint is that, because it is a web graphic, it can be used to easily create animations or graphics with interactivity. Checkout out the Gallery for some examples. To get started with animint, check out the tutorial.
Backgrounds
Last week, we were pleased to add backgrounds to animint plots. Previously, animint plots always displayed with a blank background.
With the recent addition, backgrounds, borders, and grid lines can now be included in animint plots.
# devtools::install_github("tdhock/animint") ## if necessary
library(animint)
viz <- list(p = p)
# use structure() to get animint plots in a .Rmd file
structure(viz, class = "animint")
Custom Themes
There are many custom-built themes for ggplot2 available. For example, theme_bw()
p + theme_bw()
Animint now supports these too!
viz <- list(p = p + theme_bw())
structure(viz, class = "animint")
[ggthemr](https://github.com/cttobin/ggthemr) and [ggthemes](https://github.com/jrnold/ggthemes) are two R packages that provide additional themes. Here's the standard Highcharts theme from ggthemes.
library(ggthemes)
p + theme_hc()

And here it is as an animint plot.
viz <- list(p = p + theme_hc())
structure(viz, class = "animint")
Animint handles all the ggthemr themes and most of the ggthemes (though a few aren't working quite yet).
World Maps
Altering the background easily makes a convincing world map.
library(maps)
countries <- map_data("world")

# plotting world map with ggplot2
p_world <- ggplot() +
  geom_polygon(aes(x = long, y = lat, group = group), data = countries,
               fill = "lightgrey", colour = "darkgreen") +
  theme(panel.background = element_rect(fill = "lightblue"),
        axis.line=element_blank(), axis.text=element_blank(),
        axis.ticks=element_blank(), axis.title=element_blank(),
        panel.grid.major=element_blank(), panel.grid.minor=element_blank())
structure(list(p = p_world), class = "animint")
Check out the pirate attacks vizualization for a practical application.