Hour by Hour Visualization of the Ridge Hike
Kevin
This is a short post to illustrate some cool features of animint: tooltips and links. Last weekend, I went for a hike outside Bozeman, MT. This hike starts at the Northern end of the Bridger mountains and runs 20 miles to the Southern end. I took some pictures and recorded the distance traveled each hour so we can use gglot2 and animint to visualize the hike.
Unfortunately, I have to enter all the data manually.
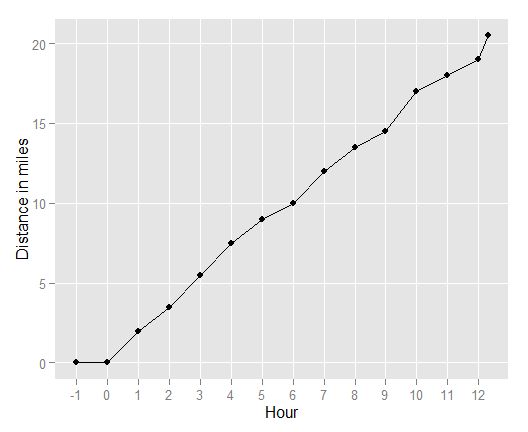
hike_data <- data.frame(hour = c(-1:12, 12.3),
                        distance = c(0, 0, 2, 3.5, 5.5, 7.5, 9, 10, 12,
                                     13.5, 14.5, 17, 18, 19, 20.5))
I also have a little description of what was happening each hour. This can become the tooltip.
hike_data$tooltip <- c("5:30am sunrise!",
                       "Slowly waking up",
                       "There's a goat",
                       "We're still pretty excited",
                       "Finally got out of the wind",
                       "Just crossed Ross Pass",
                       "We're getting artsy",
                       "Top of Bridger Bowl",
                       "Saddle Peak",
                       "Starting to get tired",
                       "Now everybody's knees are really starting to hurt",
                       "We're losing interest in pictures",
                       "Just want to be done",
                       "No more patience for pictures",
                       "5:50pm - Finished!")
I posted pictures from each hour on Facebook so I can use animint to link to these.
hike_data$links <- c("http://on.fb.me/1J60uwn",
                     "http://on.fb.me/1e5Bo3y",
                     "http://on.fb.me/1LfO7j2",
                     "http://on.fb.me/1fbTzFI",
                     "http://on.fb.me/1HzWKko",
                     "http://on.fb.me/1KbQK2f",
                     "http://on.fb.me/1gFFykH",
                     "http://on.fb.me/1Ol83zn",
                     "http://on.fb.me/1CHqyNe",
                     "http://on.fb.me/1REWtV9",
                     "http://on.fb.me/1REWw3m",
                     "http://on.fb.me/1Mba8yx",
                     "http://on.fb.me/1Ls2cbz",
                     "http://on.fb.me/1KcIK3O",
                     "http://on.fb.me/1I9mB4a")
Now we can plot. I'll draw a line using geom_line() and draw points using geom_point(). Inside geom_point(), I'll pass the tooltips and links. ggplot2 won't know what to do with them, but animint will.
library(ggplot2)
p1 <- ggplot(hike_data, aes(hour, distance)) +
  geom_line() +
  geom_point(aes(href = links, tooltip = tooltip)) +
  scale_x_continuous(breaks = -1:12,
                     name = "Hour") +
  scale_y_continuous(name = "Distance in miles") +
  theme(panel.grid.minor = element_blank())
p1
We're ready to generate the plot using animint. To view an animint visualization in a knitr document create a named list of ggplots and pass it to structure().
library(animint)
viz <- list(plot = p1)
structure(viz, class = "animint")